|
|||
Miscellaneous |
|
1. The Color Theme Calculator: You may find the color calculator handy for easy page integration. It features the same algorithm as used by the Combination and Polar/Radar 3D charts Flash movies to calculate the color theme which is set by the xml attribute called elementColor='66aadd,66ddaa'. It might be very helpful to know the exact html hexadecimal color code values especially if you are working with a fixed number of dataset or series. Simply type in these two hexadecimal color codes without the hash '#' character. The two colors will represent the first and last solid color of the smoothly fading theme. Set the step number of solid colors and click that 'calculate' button, go! |
|
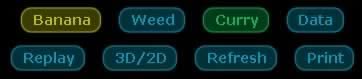
I did publish the related flash code of this color calculator algorithm as open source here just in case you would like to dynamically calculate on your own (for developers only). 2. Button Themes: Here you may find a few different XML attribute settings for the button element of the chart movies. To get you jump-started talking about the wide variety of various button designs which can be achieved simply by altering these few XML attributes. Edit the same as you like to suit your individual design. framed button XML settings: buttonOuterAlpha='100' buttonHeight='3' buttonRollOutAlpha='80' buttonRollOverAlpha='100' buttonWidth='-6' buttonHorPadding='4' buttonBevel='3' buttonInnerBrightness='-20' buttonInnerAlpha='50' |
|||||
|
|||||
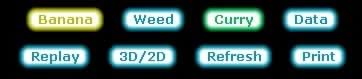
highlight 100 button XML settings: buttonOuterAlpha='100' buttonHeight='3' buttonRollOutAlpha='100' buttonRollOverAlpha='90' buttonWidth='-6' buttonHorPadding='4' buttonBevel='7' buttonInnerBrightness='100' buttonInnerAlpha='100' |
|||||
|
|||||
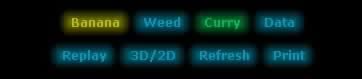
glow button XML settings: buttonOuterAlpha='50' buttonHeight='5' buttonRollOutAlpha='60' buttonRollOverAlpha='72' buttonWidth='-6' buttonHorPadding='-13' buttonInnerBrightness='0' buttonInnerAlpha='100' |
|||||
|
|||||
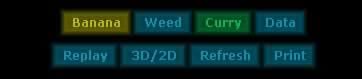
quadratic button XML settings: buttonOuterAlpha='85' buttonHeight='5' buttonRollOutAlpha='60' buttonRollOverAlpha='72' buttonWidth='-6' buttonHorPadding='-13' buttonCornerRadius='0' buttonInnerBrightness='-33' buttonInnerAlpha='100' |
|||||
|
|||||
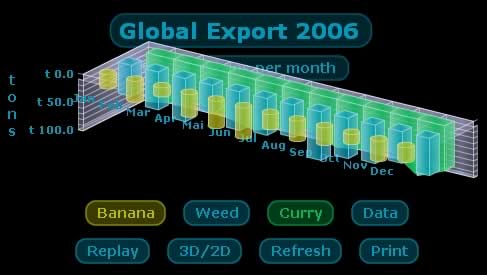
You can download the button script as open source here. You will find links inside of that movie to all relating scripts e.g. to a brightness function. 3. Anomaly What if the chart movie renders the graph yet it looks like the graph is displayed upside down as shown beneath? |
|||||
|
|||||
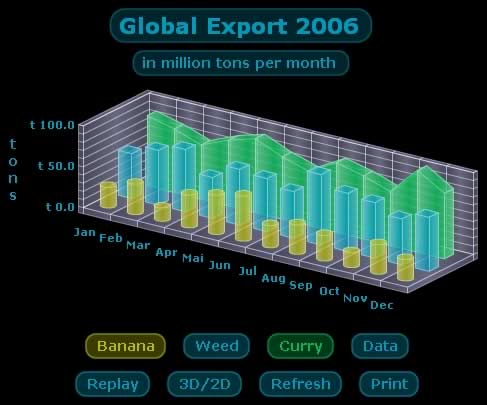
Why and when does this anomaly occur? What can you do to avoid this anomaly effect? This happens whenever there is too little space or no space on the Y-axis to render the graph between its caption above and its legend beneath. Simply avoid this by increasing the Y-axis dimension allocated to the chart's movie in its html setup container (or in its flash or its PowerPointTM container). Sometimes this anomaly occurs only after clicking from 2D to 3D mode. Well, the chart movie features a calculation that stretches the rendered graph on the X-axis to the limit and which uses all available space to the fullest. A different calculation might render always fitting yet very very tiny looking charts. As previously said to avoid this problem increase the Y-axis dimension allocated to the chart's movie in its html flash or PowerPointTM container. But you can try out two more tricks to avoid this anomaly. Try setting lower values for the two 3D positioning XML-attributes: cameraY='15' endRotationAngle='25' Especially if you haven't got extra space left on the Y-axis e.g. because of page integration reason. Anyway this anomaly will occur only while setting up your chart movie. After the described correction and after finding fitting dimensions this effect will never be visible! Your charts will always look as shown below: |
|||||
|
|||||
|
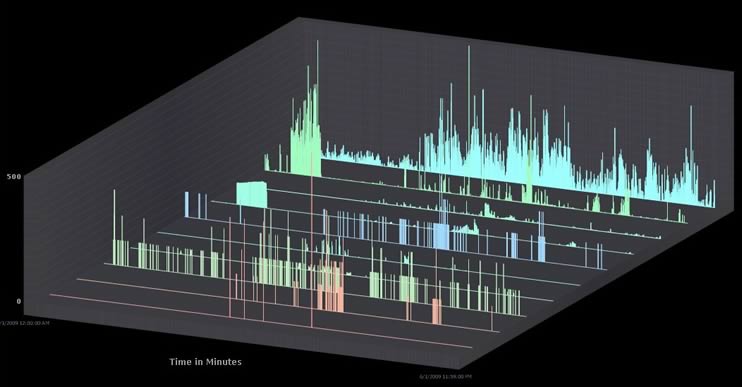
4. High volume dataset High volume dataset are supported quite well especially by the latest Flash AS3 9-10 versions but they do put a lot of strain on the flash player and may take seconds to render. You should turn off all animations to obtains a good result in this case. Air applications support an even higher number of dataset. You should take into consideration that cylinder shaped chart types use more processor capacity than column based ones although the combination of similar chart types makes the looks interesting and series easy to distinguish. Here an image of such a high volume dataset chart consisting of over 14.000 data points realized in Air (Air for developers only. Please refer to section: flash container).
5. WYSIWYG editor Due to the new security mode of Flash AS3 9-10 you might get an error prompt if trying to preview the 3D charts movie with a WYSIWYG (What You See Is What You Get) html editor. Check with the browser software instead if so. No such problems should occur if testing the Flash 6-8 AS1-AS2 compatible version of 3D charts with a WYSIWYG editor though. |